Transparency Basics
Intro
The previous section of Getting Started introduced how to get an application running via the ODJ. Once you have your runtime set up and consuming your first service etc., the ODJ will per default provide a set of transparency dashboards including widgets to different kind of metrics as already explained in the Why ODJ? section.
To sum it up, the following kind of transparency metrics can be consumed via the ODJ:
-
Different kind of cost related metrics and features to ensure you stay up to date in regards to costs and budget
- Team cost overview
- Product cost overview
- Budget and cost tracker for teams and Products
- Cost anomaly detection
- Service costs and Service costs over time
- Historical costs with trends and correlations (Performance Dashboard)
- Costs for development tools in use
-
Runtime related metrics at Product and Component level:
- Product / Component Traffic
- Product / Component Latency
- Product / Component Errors
-
Quality and Security related metrics
- Sonarqube project qualities at Product and Component level
- PRISMA alerts for GCP runtimes
- Snyk code and container issues
- Artifactory traffic and repository and user overview
None of the dashboards and widgets mentioned here are required to be manually set up. The moment you create a runtime and start consuming services, you will be provided by most of the metrics per default. The same goes for tool related metrics once you have provisioned them for your Products and Components.
Viewing the dashboards
How to view the transparency metrics provided by the ODJ:
Once you have logged in to the ODJ, your first destination is going to be "My Workspace". My Workspace sums up all the Teams and Products where you as an individual are either part as a team member or even an owner. You can easily navigate to either one of your Team or Product Dashboard.
While the Product level metrics are aggregating all of your Components data into one view, the Team is doing the same with all Products. This is mostly interesting for Teams which contain more than one Product.
Navigate to the Team Dashboard:
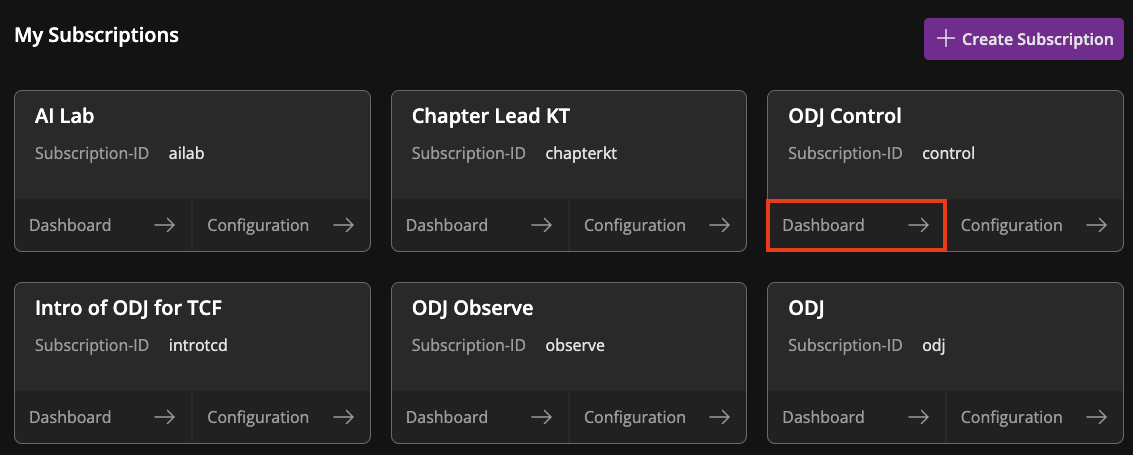
My Workspace sums up all your Teams as mentioned above and provides a quick link to each ones dashboard. Simply click the "Dashboard" button for the selected Team:

Navigate to the Product Dashboard:
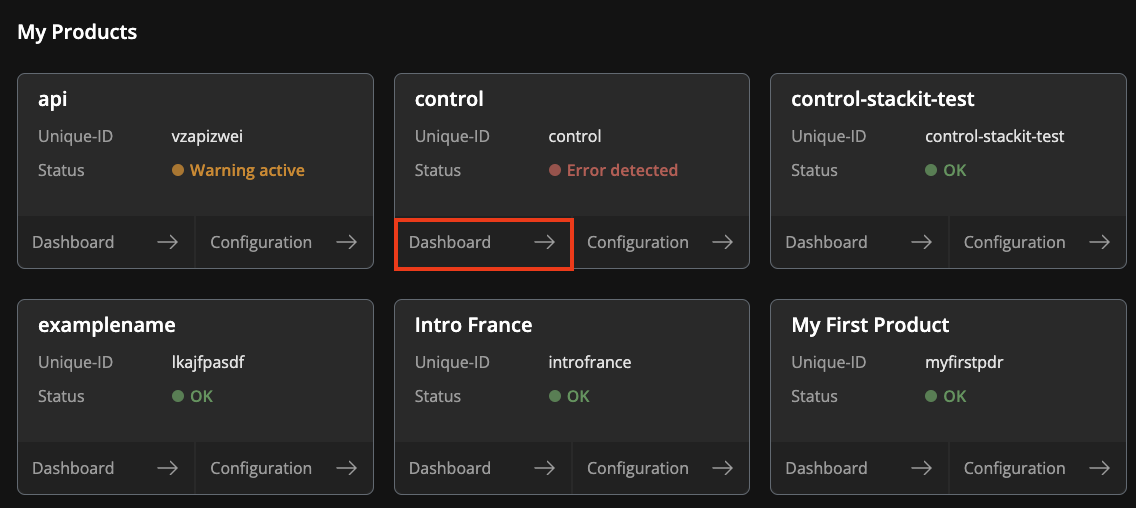
Similar to Teams, you will receive an overview over all of your Products in one section. Simply follow the "Dashboard" link at one of your Products to navigate to its dashboard.

Most of the tings happening that are interesting for your applications transparency are on a Product level. That is why you get the most insights here.
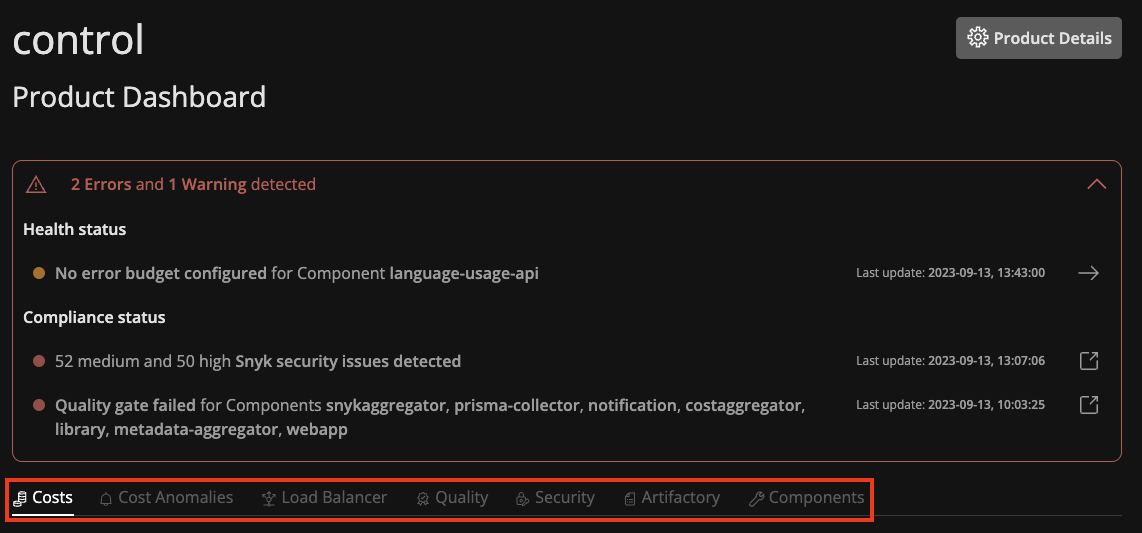
The Product dashboard provides a health section on top as a quick reference to whats wrong with your Product and its Components. The more detailed metrics can be viewed underneath the tabs for each metrics category as highlighted in the image below.
