Performance Dashboard
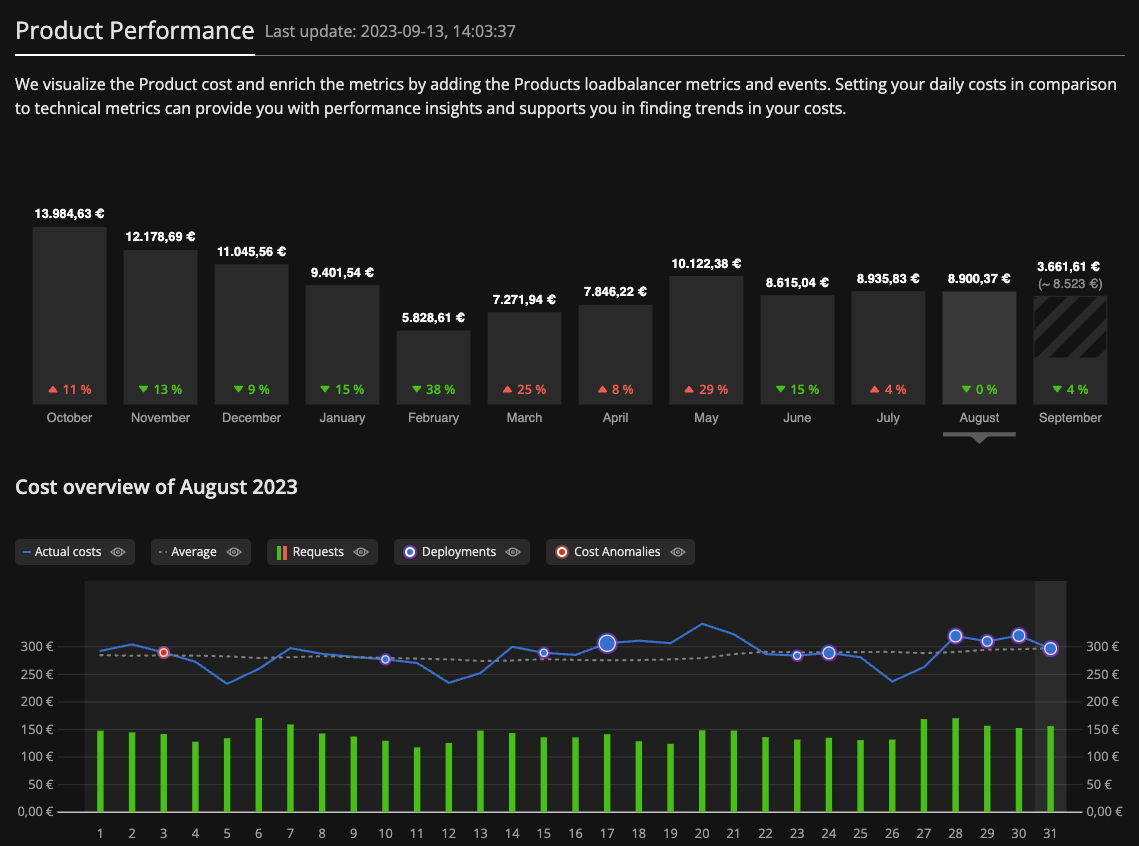
One of these widgets is the so-called cost performance chart. We show the development of a Products daily costs and add technical metrics such as the requests and error rate as well as events such as deployments or cost anomalies that happened for said product. This can help to figure out whether cost increases or decreases are due to latest deployments/cost anomalies or a high change of requests or error rate numbers. Discrepancies in costs might not necessarily always trigger a cost anomaly but there might have different reasons that affect the costs (high error rate, missing scalability).
https://odj.cloud/
